QUANTUM ESPRESSO:scf
自洽(scf)计算-获得体系基态电荷密度+波函数+构型能量
根据优化后结构的晶格常数和原子位置,设置scf.in文件
1
2
3
4
5
6
7
8
9
10
11
12
13
14
15
16
17
18
19
20
21
22
23
24
25
26
27
28
29
30
31
32
33
34
35
36
37
38
39
40
41
42
&CONTROL
    calculation   = "scf"
    restart_mode  = "from_scratch"
    prefix        = "carbyne"
    outdir        = "./outdir/"
    pseudo_dir    = "./pseudo/"
    verbosity     = "high"
    tprnfor       = .true.
    tstress       = .true.
    etot_conv_thr =  1.0d-6
/

&SYSTEM
    ibrav       = 6
    celldm(1)   = 18.89726125
    celldm(3)   = 0.256551169
    nat         = 2
    ntyp        = 1
    nbnd        = 22
    occupations = 'fixed'
    ecutwfc     =  50
    ecutrho     =  400
/

&ELECTRONS
    conv_thr         =  1.000e-9
    electron_maxstep =  200
    mixing_beta      =  0.7
    startingpot      = "atomic"
    startingwfc      = "atomic+random"
/

K_POINTS {automatic}
 1 1 200  0  0  0

ATOMIC_SPECIES
C      12.01070  C.pbe-n-kjpaw_psl.1.0.0.UPF

ATOMIC_POSITIONS (angstrom)
C             5.0000000000       5.0000000000       0.0000000000    0   0   0
C             5.0000000000       5.0000000000       1.2640744811    0   0   1
计算后得到的输出文件在文件夹outdir中,其中包括
- prefix.xml
- prefix.save
charge-density.dat (电荷密度文件)
*.UPF(赝势文件)
data-file-schema.xml
paw.txt
wfc*.dat(不可约k点的波函数)
使用下列命令可以得到体系的总能量:
1
grep ! scf.out
得到
1
!    total energy              =     -36.74406518 Ry
使用pp.x处理得到one-electron (Kohn-Sham) orbitals或者分子轨道
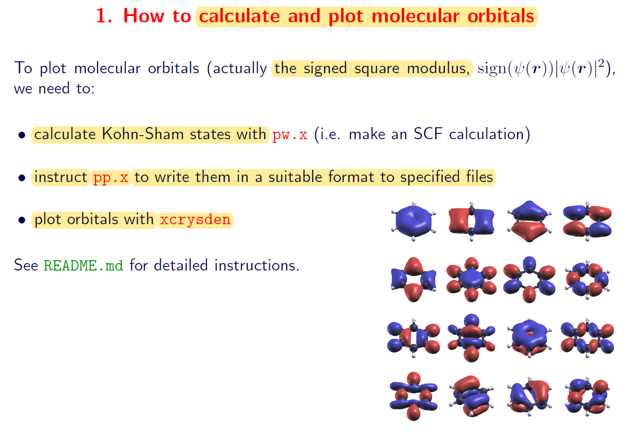
输入文件psi2.in如下:
1
2
3
4
5
6
7
8
9
10
11
12
13
14
15
16
17
18
&inputpp
prefix = 'carbyne'
outdir = './outdir'
filplot= 'psi2.carbyne'

plot_num = 7
kpoint   = 101
kband(1) = 1
kband(2) = 8
!lsign    = .true.
/
&plot
fileout = '.xsf'
iflag   = 3
nfile   = 1
output_format = 5
weight(1)= 1.0
/
输入文件具体参数设置,参考QE安装包“qe-6.8/PP/Doc/INPUT_PP.html”中的说明
其中lsign=.true. if true and k point is Gamma, plot |psi|^2 sign(psi)
输出文件得到:filplot_K_B.xsf,可以使用VESTA作图,显示波函数。
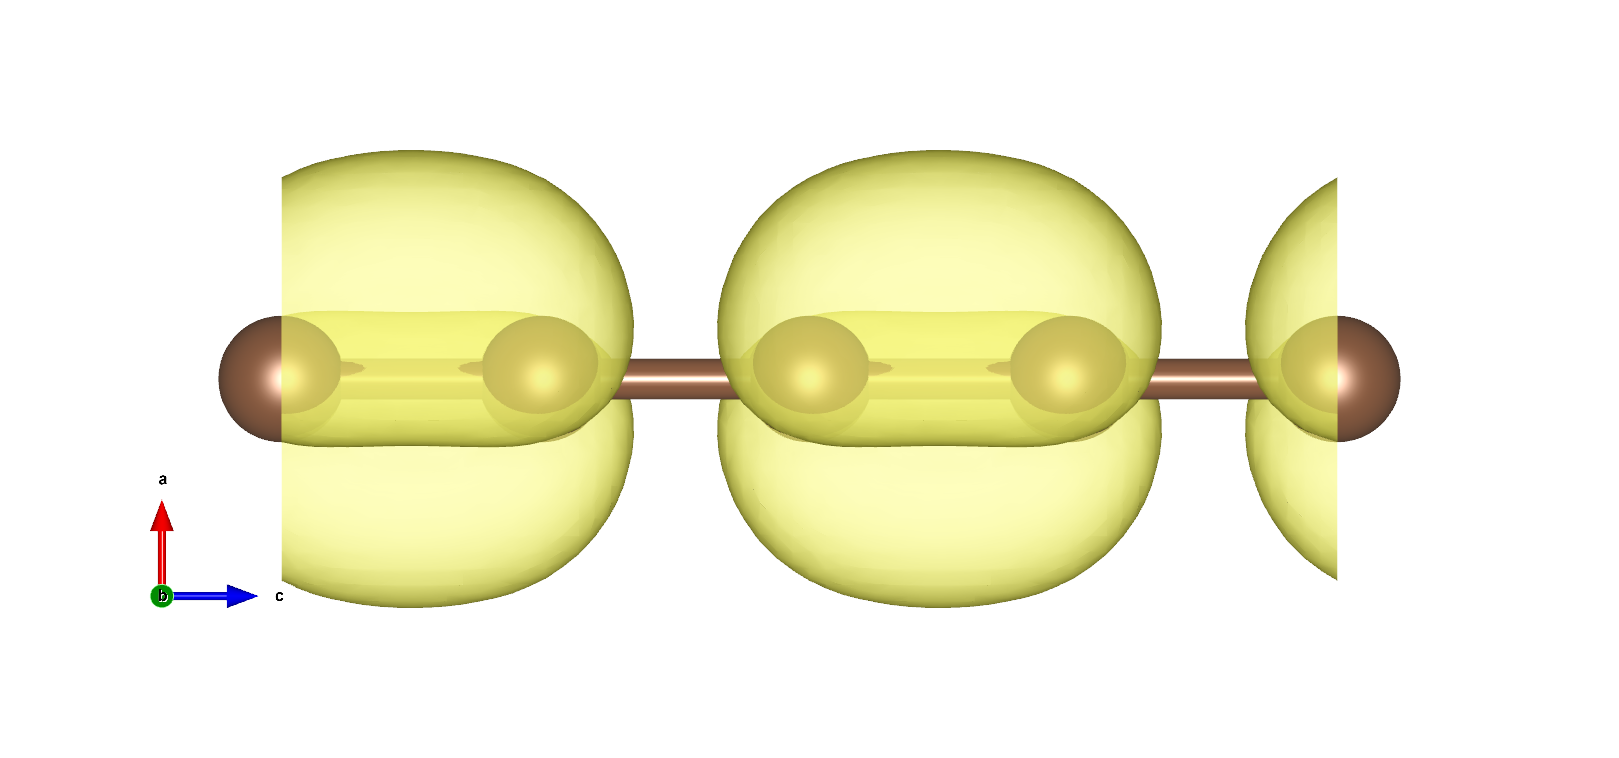
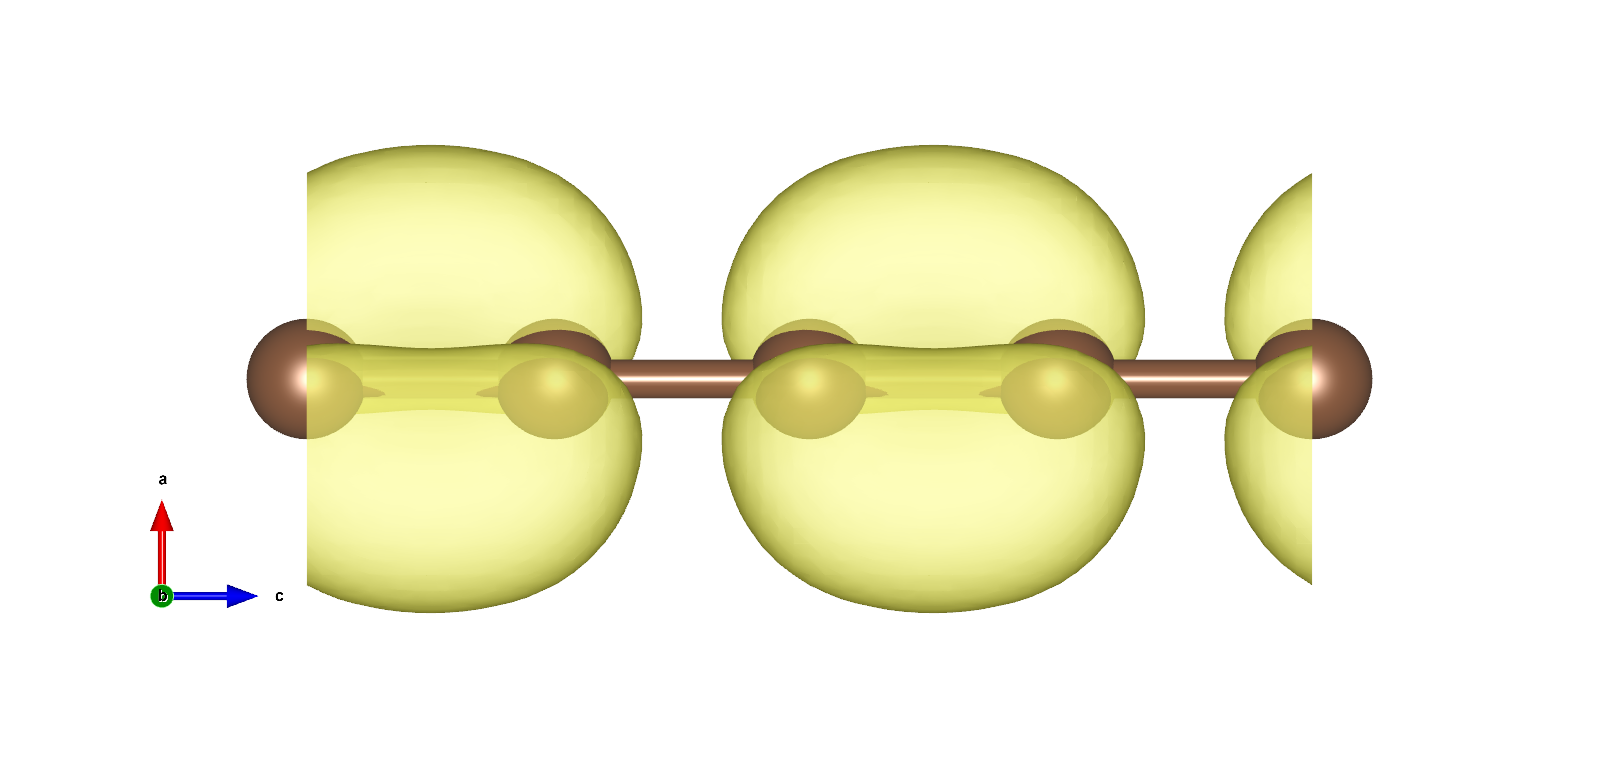
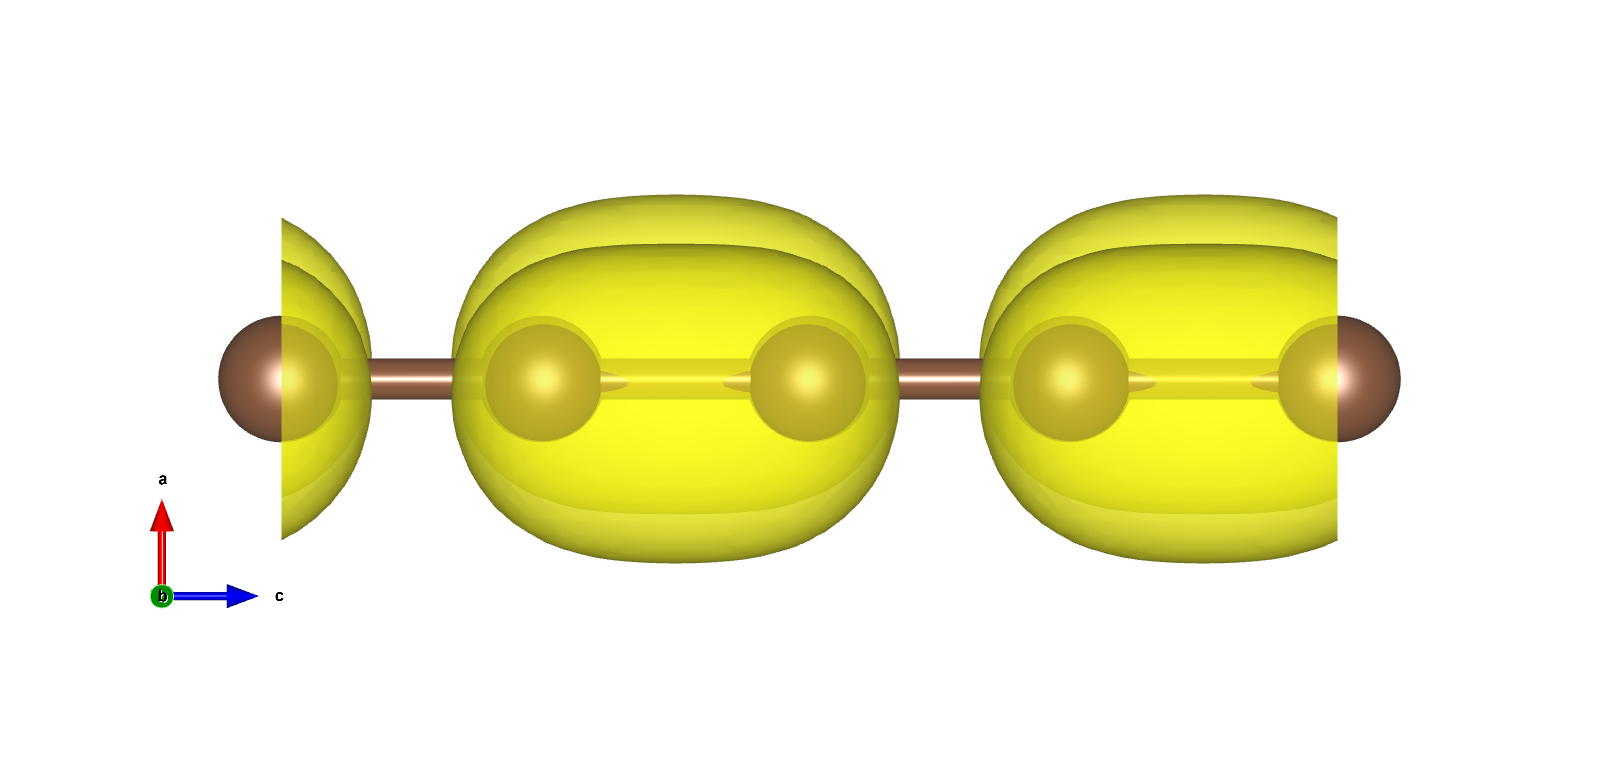
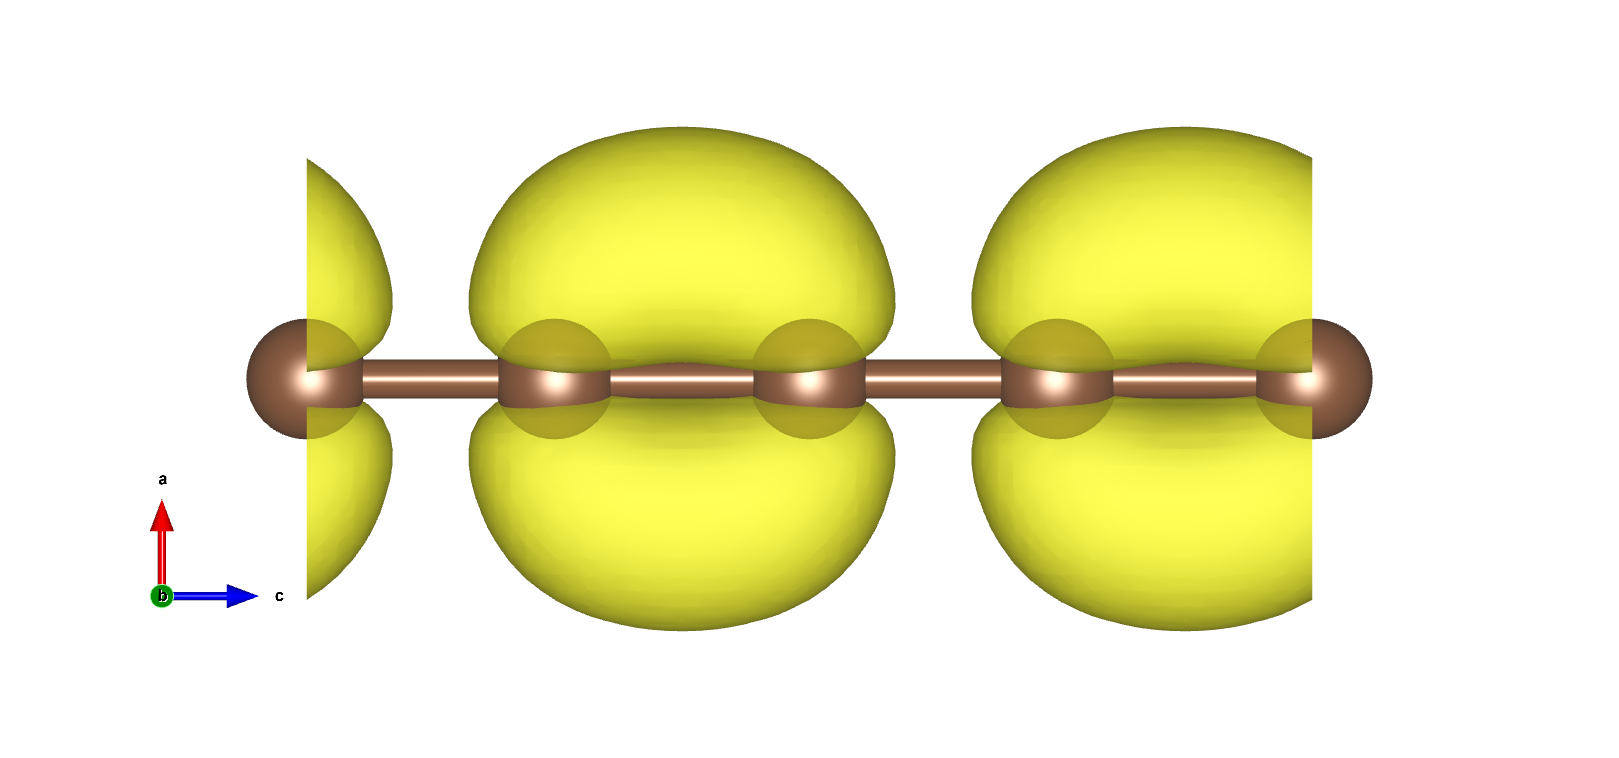
VBM以及CBM在布里渊区边界,且为二重简并,电荷密度如下图:
使用pp.x处理得到电荷密度图
输入文件rho.in如下:
1
2
3
4
5
6
7
8
9
10
11
12
13
&inputpp
prefix = 'carbyne'
outdir = './outdir'
filplot= 'carbyne.rho'
plot_num = 0
/

&plot
filepp(1)= 'carbyne.rho'
iflag   = 3
output_format = 5
fileout = 'carbyne.rho.xsf'
/
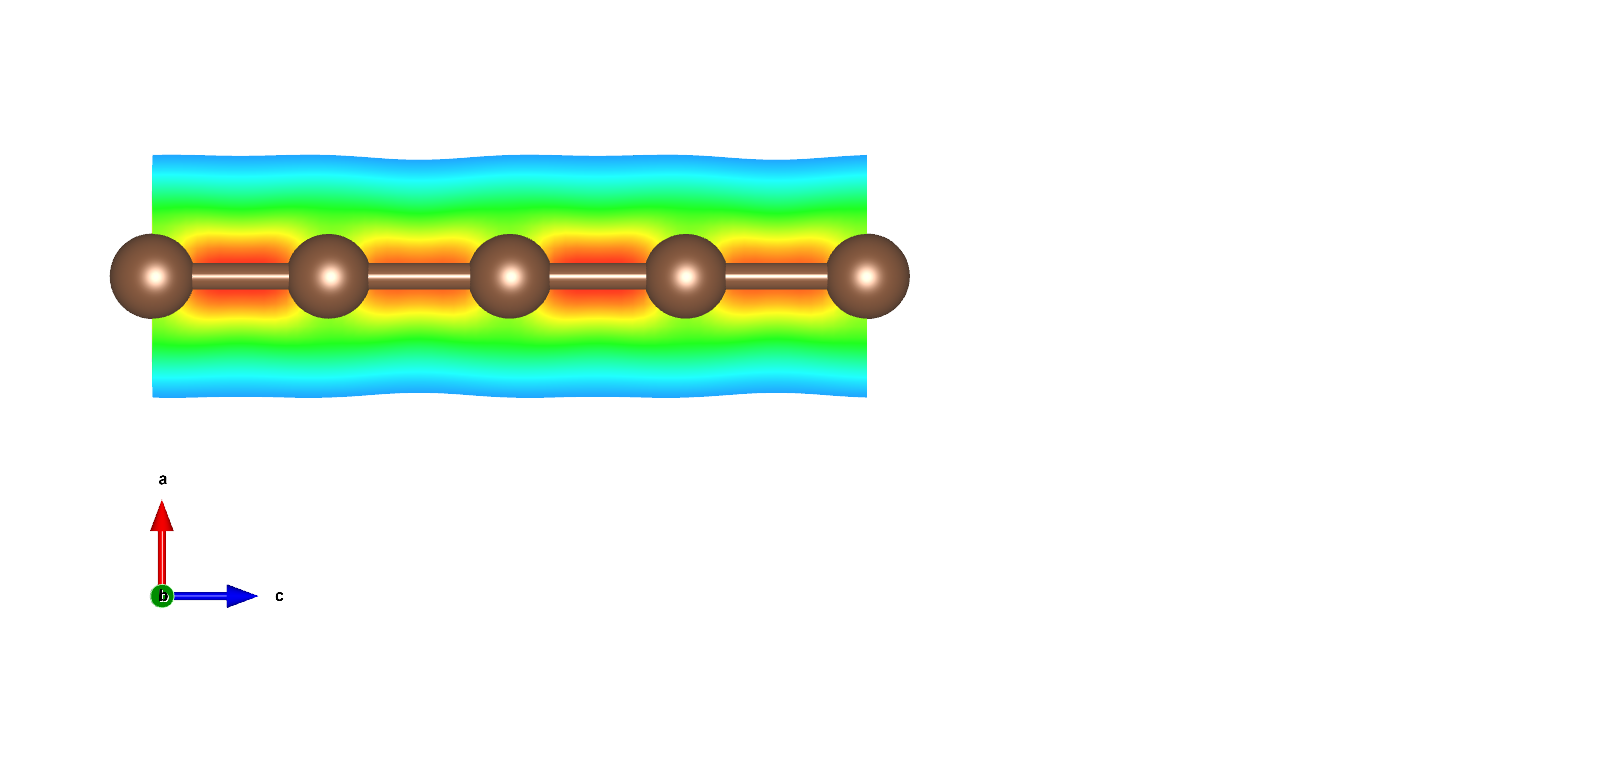
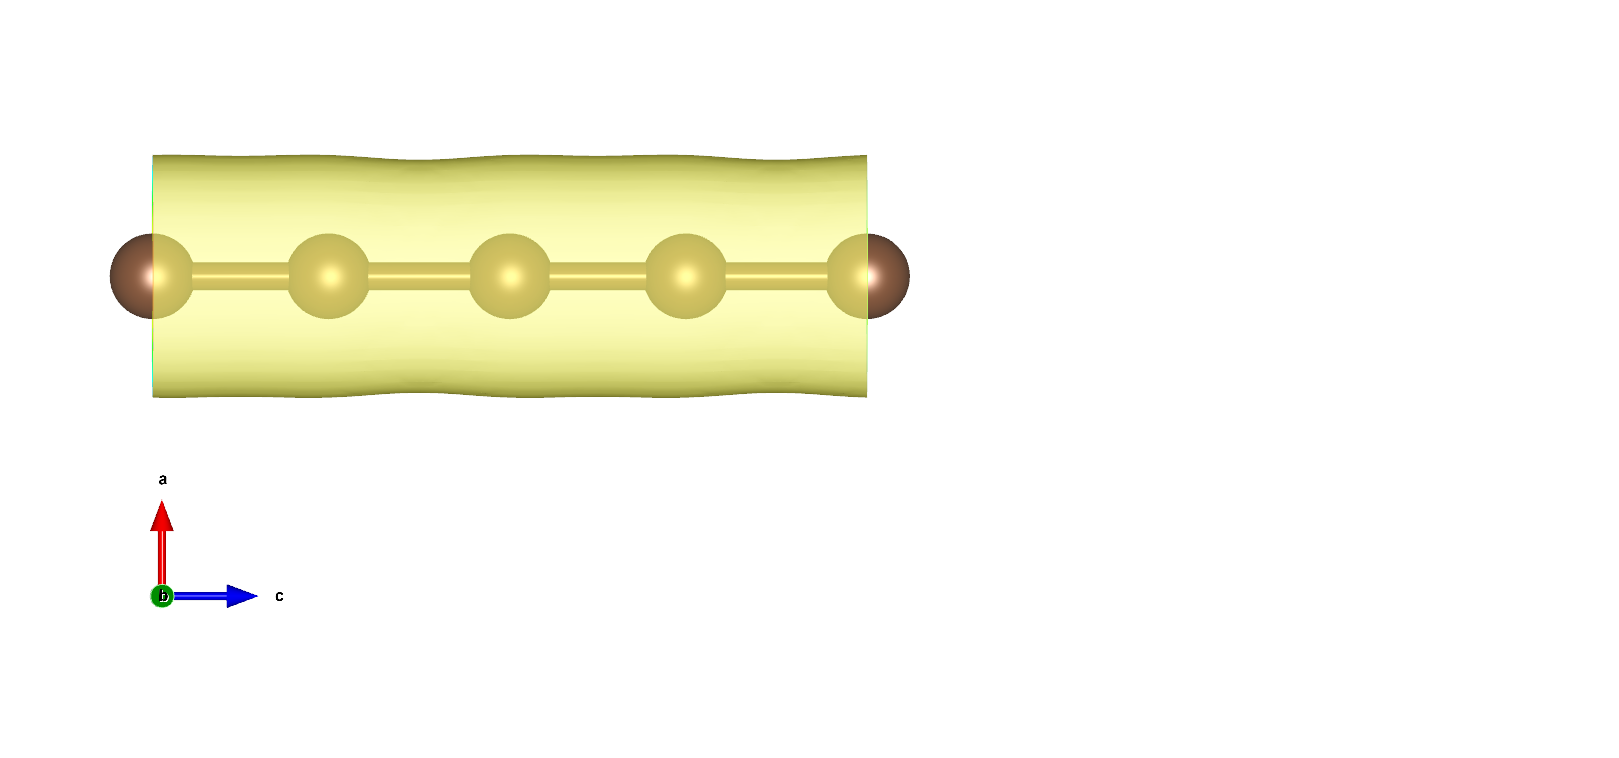
使用VESTA打开得到3D电荷密度图如下所示:
在VESTA中设置Boundary,将z(max)设置显示跟多单胞,设置Cutoff planes得到电荷密度截面:
